Understanding the Role of Advanced Practice Providers in Oncology in the United States
Purpose: Advanced practice providers (APPs, which include nurse practitioners [NPs] and physician assistants [PAs]) are integral members of oncology teams. This study aims to identify all oncology APPs and to understand personal and practice characteristics (including compensation) of those APPs.
Methods: We identified APPs who practice oncology from membership and claims data. We surveyed 3,055 APPs about their roles in clinical care.
Results: We identified at least 5,350 APPs in oncology and an additional 5,400 who might practice oncology. Survey respondents totaled 577, which provided a 19% response rate. Results focused on 540 NPs and PAs. Greater than 90% reported satisfaction with career choice. Respondents identified predominately as White (89%) and female (94%). NPs and PAs spent the majority (80%) of time in direct patient care. The top four patient care activities were patient counseling (NPs = 94%; PAs = 98%), prescribing (NPs = 93%; PAs = 97%), treatment management (NPs = 89%; PAs = 93%), and follow-up visits (NPs = 81%; PAs = 86%). A majority of all APPs reported both independent and shared visits (65% hematology/oncology/survivorship/prevention/pediatric hematology/oncology; 85% surgical/gynecologic oncology; 78% radiation oncology). A minority of APPs reported that they conducted only shared visits. Average annual compensation was between $113,000 and $115,000, which is approximately $10,000 higher than average pay for nononcology APPs.
Conclusion: We identified 5,350 oncology APPs and conclude that number may be as high as 7,000. Results suggest that practices that incorporate APPs routinely rely on them for patient care. Given the increasing number of patients with and survivors of cancer, APPs are important to ensure access to quality cancer care.
Jump to a section
Because the U.S. population is aging, a shortage of hematologists/oncologists has been projected, and this shortage increases the pressure on oncology practices to improve efficiency.1 In addition, imbalanced geographic distribution of oncologists makes access to oncology care services challenging in many regions.2 The employment of advanced practice providers (APPs)—nurse practitioners (NPs) and physician assistants (PAs)—in oncology practices has been shown to contribute greatly to cancer care.3,4 APPs have increasingly become integral members of the oncology care team. For the past three years, a majority of U.S. oncology practices that responded to the American Society of Clinical Oncology (ASCO) oncology practice census reported employment of 81% in 20175; 75% in 2016 [unpublished data]; and 73% in 20152).
Although APPs are integral members of the patient care team, there is little systematic information on the total numbers of oncology APPs, their practice settings, and their roles. Claims data do not reliably capture practice patterns because of differential policies among payers about payment of APP services.7 Claims data also often do not assign a clinical specialty to NPs and PAs.8,9 Beyond directly billable visits, APPs contribute to other aspects of care, including administration, teaching, research, and quality improvement in the areas of patient education, genetic counseling, outreach clinics, cancer prevention, and survivorship care.
ASCO, the Advanced Practitioner Society for Hematology and Oncology, the American Academy of PAs, the Association of Physician Assistants in Oncology, and the Oncology Nursing Society collaborated on this study of APPs in U.S.-based cancer care delivery. The first task attempted to identify all APPs who deliver cancer care services in the United States. The second task involved a survey to understand key demographic aspects of the oncology APP workforce. Together, the APP count and survey results provide insights on the role of APPs in oncology care delivery.
Methods
The headcount of APPs in oncology involved an analysis of three data sources with data from July to December 2016. This headcount was necessary, because a national list of oncology APPs does not exist. As an initial step, the organizations extracted data about all members with an APP professional designation. Membership lists were aggregated, and redundancies were removed. A second data source was Provider360 (P360), a proprietary healthcare provider database that captures providers with National Provider Identifiers who submit reimbursement claims to select payers. The third source was the National Plan and Provider Enumeration System, a public Centers for Medicare and Medicaid Services database. 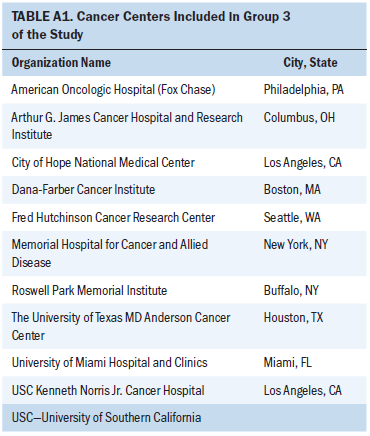
The population of APPs in oncology was modeled by creating three groups. Group 1 included two types of providers: members with NP or PA credentials, and all P360 clinicians with an APP professional designation and an oncology subspecialty according to specialty IDs and taxonomy codes from National Plan and Provider Enumeration System data. Group 2 providers included P360 providers with an oncology specialty and taxonomy indicators but no professional designation as an APP or physician. We assembled group 3 by identifying oncology practice addresses and cross-referencing results against providers with APP designations from P360. For oncology practices, we selected 10 cancer centers exempt from the Medicare Prospective Payment System and 21 large practices that participate in the Medicare Oncology Care Model initiative (see Tables A1 and A2).10,11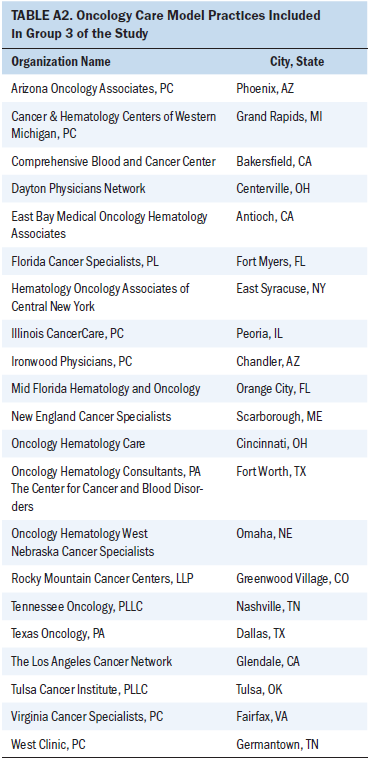
We randomly sampled from each group, and we took a larger sample size from group 1 because they were known to be NPs or PAs engaged in oncology care. For groups 2 and 3, we included fewer in the survey sample, because we assumed that fewer would be oncology APPs. The final sample size (N = 1,092) was estimated with an assumption of a 95% confidence interval (CI) and a 4% margin of error for group 1 (n = 834) and a 5% margin of error for groups 2 (n = 133) and 3 (n = 125). Because of a low response among the initial random sample, we sent a survey invitation to a convenience sample that included all members of group 1 with an email address. This resulted in an additional 1,963 survey recipients, which provided a total of 3,055.
Statistical Methods
Summary statistics and their 95% CIs were used to describe survey results. Wilcoxon rank sum tests were used to compare continuous variables across groups; Fisher’s exact tests were used to compare proportions across groups. Linear regression modeling was used to assess associations of APP characteristics with compensation. The primary outcome was based on compensation per year and was adjusted for annual hours worked. For all analyses, an alpha level of 0.05 was the threshold for statistical significance. Stata (STATA, College Station, TX) was used for statistical analyses, and R statistical software was used for figures.
Results
Overall, 5,419 APPs were identified in group 1: 3,623 were NPs, and 1,796 were PAs. Group 2 included 4,117 providers who provided oncology care but did not have APP or physician credentials. Group 3 identified a total of 1,266 providers with APP credentials who were practicing at oncology practices: 933 NPs, and 333 PAs.2
The overall response rate for the 3,055 APPs who received the survey was 19% (577 respondents: 388 were NPs, 27 were clinical nurse specialists, and 162 were PAs). The 577 respondents came from 45 states. We excluded from the analysis APPs who identified as clinical nurse specialists and any respondents who reported no provision of oncologic care, which led to a total sample size of 540 (see Table 1). The amount of missing responses for individual survey questions ranged from 3%–20%, and this percentage increased from the first to the last question. There was up to 20% missing data on demographic information.
Ninety percent of respondents identified as White. Only 4% identified as Asian; 1%, as African American; and 2%, as other; 4% preferred not to answer (see Table 1). APPs who responded were predominately female (97% of NPs; 86% of PAs). This rate is higher than in the general population of all NPs and PAs, which is estimated to be 88% and 63% female, respectively.12,13 The average NP respondent age was 49 years compared with the average PA respondent age of 42 years. These average ages are consistent with the average ages of APPs across all specialties.12,13
The average number of years of APP experience for NPs was 12 years, and an average of 11 years was spent in oncology care. PAs reported an average of 13 years of APP experience, and 10 of those years were spent in oncology. Greater than 90% of NP and PA respondents reported being very satisfied (NPs = 55%; PAs = 57%) or satisfied (NPs = 36%; PAs = 38%) with their position as an APP in oncology.
A majority of oncology APPs reported a master’s degree as the highest degree obtained (84% of NP respondents and 84% of PAs). A larger percentage of NPs (15%) than PAs (1%) had a doctorate degree (p < 0.001). Approximately 39% of NPs and 21% of PAs reported receipt of additional formal training (i.e., not on the job). A majority of APPs (86% of NPs and 95% of PAs) reported receipt of financial support for continuing education. [[{"fid":"47451","view_mode":"default","fields":{"format":"default","alignment":"","field_file_image_alt_text[und][0][value]":false,"field_file_image_title_text[und][0][value]":false},"link_text":null,"type":"media","field_deltas":{"1":{"format":"default","alignment":"","field_file_image_alt_text[und][0][value]":false,"field_file_image_title_text[und][0][value]":false}},"attributes":{"class":"media-element file-default","data-delta":"1"}}]]
[[{"fid":"47456","view_mode":"default","fields":{"format":"default","alignment":"","field_file_image_alt_text[und][0][value]":false,"field_file_image_title_text[und][0][value]":false},"link_text":null,"type":"media","field_deltas":{"2":{"format":"default","alignment":"","field_file_image_alt_text[und][0][value]":false,"field_file_image_title_text[und][0][value]":false}},"attributes":{"class":"media-element file-default","data-delta":"2"}}]]
[[{"fid":"47461","view_mode":"default","fields":{"format":"default","alignment":"","field_file_image_alt_text[und][0][value]":false,"field_file_image_title_text[und][0][value]":false},"link_text":null,"type":"media","field_deltas":{"3":{"format":"default","alignment":"","field_file_image_alt_text[und][0][value]":false,"field_file_image_title_text[und][0][value]":false}},"attributes":{"class":"media-element file-default","data-delta":"3"}}]]
[[{"fid":"47466","view_mode":"default","fields":{"format":"default","alignment":"","field_file_image_alt_text[und][0][value]":false,"field_file_image_title_text[und][0][value]":false},"link_text":null,"type":"media","field_deltas":{"4":{"format":"default","alignment":"","field_file_image_alt_text[und][0][value]":false,"field_file_image_title_text[und][0][value]":false}},"attributes":{"class":"media-element file-default","data-delta":"4"}}]]
[[{"fid":"47471","view_mode":"default","fields":{"format":"default","alignment":"","field_file_image_alt_text[und][0][value]":false,"field_file_image_title_text[und][0][value]":false},"link_text":null,"type":"media","field_deltas":{"5":{"format":"default","alignment":"","field_file_image_alt_text[und][0][value]":false,"field_file_image_title_text[und][0][value]":false}},"attributes":{"class":"media-element file-default","data-delta":"5"}}]]
[[{"fid":"47476","view_mode":"default","fields":{"format":"default","alignment":"","field_file_image_alt_text[und][0][value]":false,"field_file_image_title_text[und][0][value]":false},"link_text":null,"type":"media","field_deltas":{"6":{"format":"default","alignment":"","field_file_image_alt_text[und][0][value]":false,"field_file_image_title_text[und][0][value]":false}},"attributes":{"class":"media-element file-default","data-delta":"6"}}]]
APP Clinical Settings
APPs were asked to indicate what specialty areas most aligned with their clinical practice. The question allowed multiple answers and included all oncology subspecialties, urology, dermatology, and surgery as well as survivorship and prevention (see Table 1). The most frequently selected were as follows: hematology/oncology (n = 374; 72%), survivorship (n = 70; 13%), surgical oncology (n = 48; 9%), gynecologic oncology (n = 39; 7%), and radiation oncology (n = 34; 6.5%). Roughly half (52%) of respondents reported working in academic practices, although there was a statistically significant difference between responses by NPs and PAs (47% of NPs and 63% of PAs; p = 0.001). Approximately 22% of NPs were employed by hospital-owned, nonacademic practices, but only 11% of PAs were similarly employed (p = 0.007). Physician-owned practices employed 21% of NPs and 19% of PAs.
NPs and PAs work with approximately the same average number of oncologists. A majority of APPs reported working in small- and medium-sized practices with either 1–5 oncologists (42%) or 6–10 oncologists (28%). Fewer APPs reported working in larger oncology practices with 11 to 25 oncologists (21%) and 26 or more oncologists (9%). Approximately 10% of PAs work in a satellite office compared with 15% of NPs, and 30% of NPs and 26% of PAs work at multiple sites.
APP Services
We asked APPs to report the percentage of time spent across five types of activities in a typical week (see Figure 1). NPs and PAs allocated approximately the same time to direct patient care (medians of 85% and 80% for NPs and PAs, respectively) and no significant geographic differences. APPs who reported working in hematology/oncology spent a median of 85% of their time in direct patient care, whereas those in a surgical subspecialty spent 84%, and those in survivorship reported a median of 75% of their time in direct patient care. APPs in academic facilities spent a median of 80% of their time in direct patient care, which is lower than the rate reported by APPs in physician-owned group practices (median, 90%), and hospital-owned or health system practices (median, 85%). 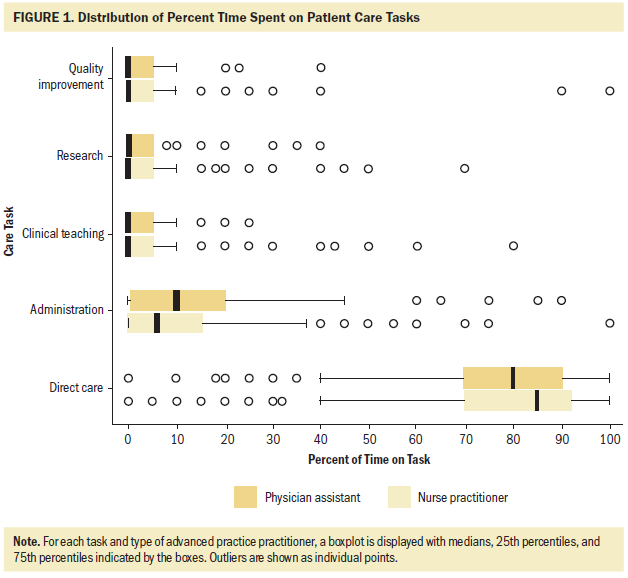
Figure 2 provides an overview of the types of direct patient care services that NPs and PAs provide. The top four patient care activities were patient counseling (NPs, 94%; PAs, 98%), prescribing (NPs, 93%; PAs, 97%), treatment management (NPs, 89%; PAs, 93%), and follow-up visits (NPs, 81%; PAs, 86%). PAs indicated that they were significantly more likely than NPs to evaluate new patients, conduct inpatient rounds, perform procedures, and perform first assists in surgery (p < 0.05 for each comparison). No significant difference existed in services that NPs performed compared with PAs. There was overall no significant experience-related variation in the types of patient care services, which suggests that APPs with more experience perform the same types of tasks but that the amount of time they spend on them differs compared with those with less experience. APPs in a surgical specialty were most likely to evaluate new patients; 75% reported that they perform this task compared with 50% of APPs who identified as hematology/oncology specialists (p = 0.002) and 48% who identified as survivorship specialists (p = 0.16). 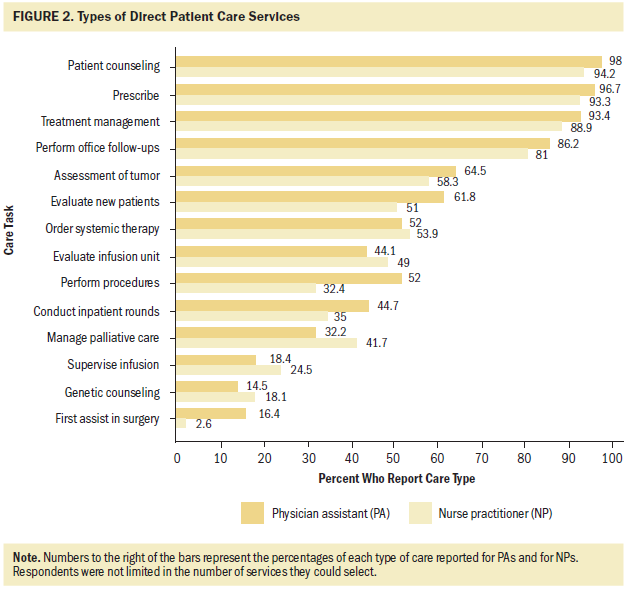
Practice Model
The survey presented three models for how APPs work with oncologists: independent visits only (when an APP sees patients independently but works with physicians to address the most critical care decisions, such as treatment plans and end-of-life decisions), shared visits only (when both APP and physician see the patient), or both types of visits.14 We asked APPs to choose the top three factors that most affected or determined their practice models. NPs ranked physician preference (73%), employer policy (52%), and state scope of practice laws (39%) as the top three factors. PAs reported physician preference (82%), employer policy (52%), and patient complexity (33%) as their most common determinants. More than 40% of APPs reported that a physician must cosign their notes or orders, and more than 40% reported that a physician must review their charts. Approximately 25% of NPs and 33% of PAs reported that they cannot write prescriptions for chemotherapy at their practice.
The majority of NPs and PAs reported they are very satisfied (34% of NPs; 29% of PAs) or satisfied (46% of NPs; 47% of PAs) with their practice model. A small percentage reported that they were unsatisfied (6% of NPs; 6% of PAs) or very unsatisfied (1% of NPs; 2% of PAs), and the remaining approximately 15% reported neutral feelings about the practice model. APPs who practice in independent models report the highest level of satisfaction (85%), whereas those who practice in models with both types of visits and those with a shared-only type report lower levels (77% and 67%, respectively; p = 0.07).
We asked APPs to indicate what portion of their patient visits were performed independently and with a physician. We removed from the analysis APPs who did not provide direct patient care. Because there may be differences in care patterns by type of oncology subspecialty, we also differentiated between APPs who work in the following settings: (1) medical oncology, hematology, pediatric hematology/oncology, survivorship, and prevention (n = 348, hereafter called hematology/oncology); (2) surgical and gynecologic oncology (n = 68); and (3) radiation oncology (n = 27; see Table 1). A minority of hematology/oncology APPs (7.5%) reported that they conducted only shared visits, but only one APP in surgical/gynecologic and one in radiation reported this. A majority of all APPs reported conducting both independent and shared visits (65% in hematology/oncology; 85% in surgical/gynecologic; 78% in radiation). Just greater than 25% of hematology/oncology APPs, 13% of surgical/gynecologic APPs, and 19% of radiation APPs conducted only independent visits.
We asked respondents to report the number of visits they provide during a typical week. We restricted this analysis to APPs who reported spending at least 85% of their time in direct patient care, because this was the median percentage for those involved in patient care (see Figure 1). Of hematology/oncology APPs, NPs who conducted both shared and independent visits conducted a median of 51 total visits per week (33 independent visits and 11 shared visits). Similarly, PAs who reported conducting both types of visits reported a median of 56.5 total visits per week (43.5 independent visits and 7.5 shared visits). NPs who exclusively performed independent visits had a median of 50 weekly visits, and PAs reported a median of 78 visits. Those who reported only shared visits had medians of 26 (NPs) and 32 (PAs) visits per week.
Because we had a small number of surgical/gynecologic and radiation oncology APPs who reported data, we reported the visits-per-week analysis in total rather than separately by independent and shared visits. APPs in surgical/gynecologic oncology who conduct both types of visits reported a median of 50.5 visits per week. APPs in radiation oncology who conduct both types of visits reported a median of 60 visits per week.
Compensation
Overall, oncology NP respondents earn an average of $115,580, and oncology PA respondents earn an average of $113,437 per year.15,16 The survey asked APPs to report their salary according to the following categories: (1) base salary, (2) bonus/incentive/performance pay, (3) on-call compensation, and (4) extra clinic hours pay. Most survey respondents (75%) reported that more than 95% of their compensation was from their base salary. Approximately 67% of NPs and 65% of PAs reported that they are either satisfied or very satisfied with their compensation. APPs who reported that they were either satisfied or very satisfied with their compensation earned averages of $121,974 (NPs) and $119,720 (PAs).
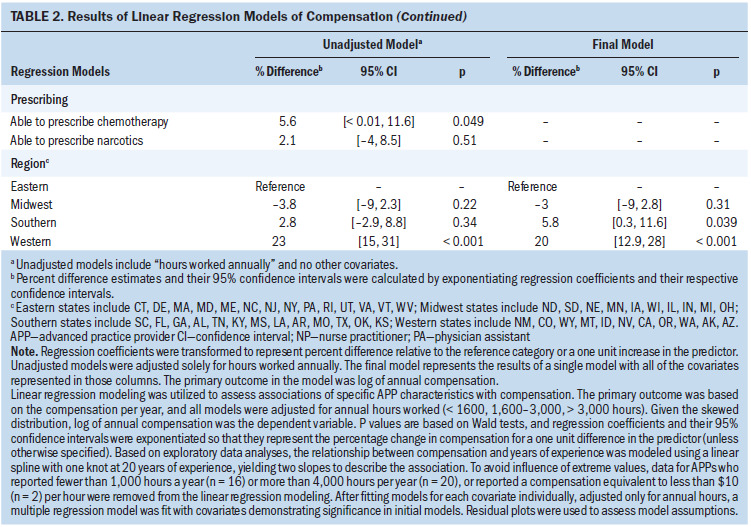
To identify determinants of earnings, we fit a series of linear regression models that were adjusted for annual hours worked. There was a positive association between years of experience and compensation, but this plateaued beyond 20 years of experience. Thus, we used two different models to examine the association: one for APPs with fewer than 20 years of experience and another for APPs with 20 or more years of experience.
Table 2 lists results from models that include only the factor of interest adjusted for annual hours worked. The final model includes all of the factors that demonstrated statistical significance. Inferences focus on the final model. Compensation was highest in Western states (20% higher than in Eastern states); in academic practices (7.5% higher than in physician owned); and in practices with more than 25 physicians (11% higher than in practices with 5 or fewer physicians). There was a trend toward significance of sex: male APPs earned approximately 7% more after analysis was adjusted for factors that included years of experience and hours worked. Compensation increased with annual hours worked. APPs who worked fewer than 1,600 hours annually (approximately 32 hours/week) had salaries that were 22% lower than those who worked between 1,600 and 3,000 hours per year (approximately 32 to 60 hours/week). APPs who worked more than 3,000 hours annually earned 5.9% more on average than those who worked 1,600–3,000 hours. Years of experience was positively associated with greater compensation for those who had fewer than 20 years of experience, and there was a negligible difference in salaries for those with more than 20 years of experience. 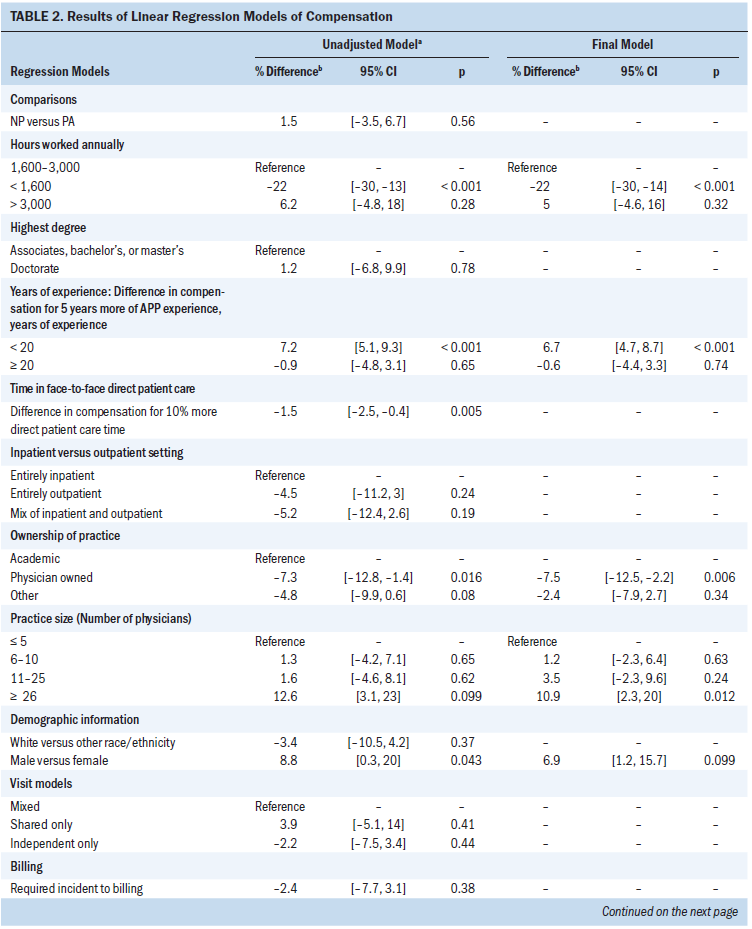
Discussion
Without comprehensive data about the number of APPs and their activities, workforce planning is difficult. Our ability to identify all of the NPs and PAs who work in oncology in the United States was greatly constrained by the lack of a database of APPs and by the relatively low response rate to the survey. We relied on compilations of specialty membership databases, but not all APPs belong to a professional society. Validation with claims-based information also was constrained, because payer policies on APP reimbursement vary.
Membership and claims data indicated that at least 5,350 APPs work in oncology in the United States (group 1, adjusted by 1% to exclude potential clinical nurse specialists, according to survey respondents). We also identified from claims-based data another 1,266 providers with APP credentials who were practicing at known oncology practices (group 3). Because these practices are known to provide oncology care, it is likely that a portion of these APPs are oncology specialists; however, many of these sites also provide nononcology care. Group 2 included 4,117 providers who provide oncology care (according to claims data), but these providers lacked APP and physician credentials. Because there are more physicians than APPs in practice, there is a greater likelihood that physicians comprised most of this group. Unfortunately, we received few survey responses from groups 2 and 3, so we cannot verify whether some are APPs in oncology care.
As a result, the population of APPs who work in oncology is likely somewhat larger than 5,350 but probably not as large as the combination of all three groups (N = 10,733). We posit that the number of oncology APPs ranges from 5,350 to 7,000. As a comparator, 394 oncology practices that participated in the 2017 ASCO Oncology Practice Census (roughly 18% of oncology practices in the United States) reported employment of 5,671 APPs.6,17 National data on the NP and PA workforce do not always note APPs who specialize in oncology. Data on NPs from 2013 indicated that 1% (approximately 1,900) of NPs practice in oncology.18 Although the 2018 NP numbers are not broken out for oncology, application of this 1% rate to the 248,000 licensed NPs would translate to approximately 2,480 NPs in oncology.19 Data about PAs from 2013 estimated that 2% of 93,098 PAs (approximately 1,800) worked in oncology.20,21 Data from 2017 about certified PAs identified more than 2,000 PAs across all oncology subspecialties.22
APP respondents indicated significant satisfaction with their work. The satisfaction relates to the position as an APP in oncology (greater than 90%), collaborative practice with oncologists (80% of NPs; 76% of PAs), and compensation (67% of NPs; 65% of PAs). Compensation for APPs who pursue an oncology specialty was, on average, approximately $10,000 greater than that of APPs in other specialties. The U.S. Bureau of Labor Statistics reported average total compensations in 2016 of $104,610 for NPs and $101,480 for PAs.15,16 APPs who work in practices with more than 25 oncologists have 10% higher salaries than all survey respondents.
The study provides baseline data to indicate that APPs spend a majority of their time in patient care and conduct a wide array of patient care services, from new patient visits to follow-up care, as well as more specialized services, such as genetic counseling, surgery first assists, and procedures. Although we reported the number of visits as a way to gauge the clinical role of APPs in oncology, the visit-based approach may not adequately account for the way in which APPs increase the diversity of services offered to patients with cancer. Alternate measures should take into account not only the quantity but also the broadened scope of services.
As defined in this survey and elsewhere in the literature, independent practice for APPs in oncology involves collaborative work with physicians on complex cases.14 This team-based approach differs from the model for independent practice in primary care settings. With the growing complexity of care, collaborative care between APPs and physicians will likely continue to be important.23 This study revealed that most APPs engaged in chemotherapy delivery, prevention, and survivorship care see patients independently. A minority of APPs reported shared-only visits. These APPs with shared-only visits accomplished the fewest number of visits per week. Satisfaction rates were high overall, but those in a shared-only model had lower satisfaction (67%) than those in independent-only (85%) and combined independent/shared (77%) settings. Together, these factors suggest that an independent model in a collaborative setting results in more capacity for patient care and greater APP satisfaction. Although laws and regulations that govern APP practice vary considerably between states and regions,24,25 survey respondents indicated that physician preference and employer policy—not state scope-of-practice laws—were the most significant factors to influence the choice of practice model.
Two limitations of this study should be noted. First, the universe of APPs who practice in oncology was uncertain. Second, the response rate to the survey was low. Together, these two factors suggest that direct inferences from the sample to the general population of APPs in oncology should be interpreted with caution. Nevertheless, characteristics of the respondents and current knowledge about the characteristics of the population of APPs in general are quite close.
Additional research that engages both APPs and physicians could help describe effective strategies to work collaboratively and examine connections to patient outcomes and quality of care. This information would help make connections to the national goal of movement toward value-based purchasing.
In conclusion, APPs have increasingly become integral members of the oncology care delivery team. The survey results suggest that practices that incorporate APPs in oncology care predominantly involve them in direct patient care, which includes counseling, prescribing, management, and follow-up. With the growing complexity of care, an independent model in a collaborative setting results in greater APP satisfaction and increases patient care capacity. Given the increasing number of patients with and survivors of cancer, APPs are important to ensure continued access to quality cancer care.
The authors gratefully acknowledge the following work group members to this project: Dawn Hershman, MD, MS (Columbia University Medical Center); Steve Gualdoni, PA-C (Upper Peninsula Hematology Oncology); Michele McCorkle (Oncology Nursing Society); Ryan Ramaekers, MD (St Francis Medical Center); and Carrie Stricker, PhD, CRNP (University of Pennsylvania). The authors also thank The Lewin Group, led by Paul Hogan, PhD, and including Brian Mercer and James Williams, for data collection and initial analysis.
About the Author(s)
Author institutions: American Society of Clinical Oncology; American Academy of PAs, Alexandria, VA; The University of Texas MD Anderson Cancer Center, Houston, TX; Ballad Health, Kingsport, TN; Fox Chase Cancer Center, Philadelphia, PA; University of Pittsburgh, PA; Fox Chase Cancer Center, Philadelphia, PA; Memorial Sloan Kettering Cancer Center, New York, NY; Advanced Practitioner Society for Hematology and Oncology, Lawrenceville, NJ; Scripps Clinic, La Jolla, CA; and Spectrum Health Systems, Grand Rapids, MI. Bruinooge, Pickard, Vogel, Hanley, Schenkel, Tetzlaff, Hylton, Westin, Smith, Lynch, Kosty, and Williams contributed to the conception and design. Bruinooge, Pickard, Hanley, Schenkel, Smith, Kosty, and Williams contributed to collection and assembly of data. Bruinooge, Pickard, Vogel, Schenkel, Garrett-Mayer, Tetzlaff, Rosenzweig, Hylton, Westin, Smith, and Williams provided data analysis and interpretation. Bruinooge and Schenkel provided administrative support and Bruinooge was responsible for the provision of study materials or patients. All authors were responsible for manuscript writing and final approval and all authors are accountable for all aspects of work. Funded in part by the Conquer CancerTM Foundation Mission Endowment of ASCO. M.P.K. and S.F.W. contributed equally to this work. This article was developed as a consensus document of the APPs in Oncology Work Group as part of a collaboration between ASCO, American Academy of PAs, Association of Physician Assistants in Oncology, Advanced Practitioner Society for Hematology and Oncology, and Oncology Nursing Society. The opinions expressed in this work are those of the authors and do not necessarily reflect the views or policies of the author’s affiliated institutions. Bruinooge, Pickard, Hanley, Schenkel, Tetzlaff, Rosenzweig, Hylton, Smith, and Lynch have no financial relationships to disclose. Vogel has been on speakers’ bureaus for Amgen, Celgene, Ipsen, Novartis, and Pfizer. Garrett-Mayer has stock and other ownership interests in Abbott Laboratories and Abbvie and has held consulting or advisory roles with Tactical Therapeutics and Okava Pharmaceuticals. Westin has held consulting or advisory roles with AstraZeneca, Ovation Sciences, Medivation, Genentech, Vermillion, Casdin Capital, Medscape, Clovis Oncology, Watermark Research Partners, Gerson Lehrman Group, Vaniam Group, BioAscent, and Tesaro and has obtained research funding from AstraZeneca: Novartis, Merck, Biomarin, GlaxoSmithKline, Karyopharm Therapeutics (immediate family member [I]), Celgene (I), Critical Outcome Technologies, Bayer, Tesaro, Kite Pharma (I), Cotinga Pharmaceuticals. Kosty has held consulting or advisory roles at Biocept and has been on speakers’ bureaus for Astellas Pharma, Genentech, Roche, Sanofi, Lilly, Bayer, Medivation, Astellas, Novartis, Bristol-Myers Squibb, Janssen Oncology, Pfizer, and Merck Sharp & Dohme. Williams has held consulting or advisory roles at CVS Caremark. Corresponding author: Suanna S. Bruinooge, MPH, Center for Research and Analytics, American Society of Clinical Oncology, 2318 Mill Rd, Suite 800, Alexandria, VA 22314; e-mail: suanna.bruinooge@asco.org.
References
1. Yang W, Williams JH, Hogan PF, et al: Projected supply of and demand for oncologists and radiation oncologists through 2025: An aging, better-insured population will result in shortage. J Oncol Pract 10:39-45, 2014
2. American Society of Clinical Oncology: The State of Cancer Care in America, 2016: A report by the American Society of Clinical Oncology. J Oncol Pract 12:339-383, 2016
3. Association of American Medical Colleges: Forecasting the supply of and demand of oncologists: A report to the American Society of Clinical Oncology (ASCO) from the AAMC Center for Workforce Studies, 2007, https://www.asco.org/sites/new-www.asco.org/files/content-files/researc…
4. Towle EL, Barr TR, Hanley A, et al: Results of the ASCO study of collaborative practice arrangements. J Oncol Pract 7:278-282, 2011
5. American Society of Clinical Oncology: The State of Cancer Care in America, 2017: A report by the American Society of Clinical Oncology. J Oncol Pract 13:e353-e394, 2017
6. American Society of Clinical Oncology: ASCO oncology practice census data, 2018.
7. Agrawal N: Understanding Medicare Part B incident to billing. http://bulletin.facs.org/2016/08/understanding-medicare-part-b-incident…
8. Centers for Medicare & Medicaid Services: Physician compare data FAQ 2016. https://www.cms.gov/Medicare/Quality-Initiatives-Patient-Assessment-Ins…
9. Bindman AB: Using the National Provider Identifier for health care workforce evaluation. Medicare Medicaid Res Rev 3:E1-E10, 2013
10. Centers for Medicare & Medicaid Services: Oncology Care Model 2018. https://innovation.cms.gov/initiatives/oncology-care/
11. Centers for Medicare & Medicaid Services: PPS-Exempt Cancer Hospitals. https://www.cms.gov/Medicare/Medicare-Fee-for-Service-Payment/AcuteInpa…
12. American Association of Nurse Practitioners: NP Fact Sheet 2018, https://www.aanp.org/all-about-nps/np-fact-sheet
13. Hooker RS, Cawley JF, Everett CM: Predictive modeling the physician assistant supply: 2010-2025. Public Health Rep 126:708-716, 2011
14. Buswell LA, Ponte PR, Shulman LN: Provider practice models in ambulatory oncology practice: Analysis of productivity, revenue, and provider and patient satisfaction. J Oncol Pract 5:188-192, 2009
15. Bureau of Labor Statistics: US Department of Labor Occupational Employment and Wages, May 2016: Nurse Practitioners. Washington DC, US Department of Labor, 2017
16. Bureau of Labor Statistics: US Department of Labor Occupational Outlook Handbook: 2016—Physician Assistants (ed 17). Washington DC, US Department of Labor, 2017
17. Kirkwood K, Hanley A, Bruinooge S, et al: The state of oncology practice in America 2018: Results of the ASCO practice census survey. J Oncol Pract 14:e412-e420, 2018
18. American Association of Nurse Practitioners (AANP): NP facts, 2013. https://aanp.org/images/documents/research/2013-14nationalnpcensusrepor…
19. American Association of Nurse Practitioners (AANP): NP facts, 2017. https://www.aanp.org/images/documents/about-nps/npfacts.pdf
20. American Academy of PAs (AAPA). AAPA Annual Survey Report. Alexandria, VA, APPA, 2013.
21. American Academy of PAs (AAPA): 2010 AAPA Physician Assistant Census. Alexandria, VA, APPA, 2011
22. National Commission on Certification of Physician Assistants (NCCPA). 2017 Specialty Report. Johns Creek, GA, NCCPA, 2018.
23. Heymach J, Krilov L, Alberg A, et al: Clinical cancer advances 2018: Annual report on progress against cancer from the American Society of Clinical Oncology. J Clin Oncol 36:1020-1044, 2018
24. The Kaiser Family Foundation: State health facts: Physician assistant scope of practice laws, 2015. https://www.kff.org/other/state-indicator/physician-assistant-scope-of-…
25. The Kaiser Family Foundation: State health facts: Nurse practitioner scope of practice laws, 2015. https://www.kff.org/other/state-indicator/total-nurse-practitioners/